Storyboarding, or user story mapping, as described by Jeff Patton, is a central part of our Agile development process. We use it whenever we are doing feature discovery and it helps us structure our ideas without constraining the discussion. A lot of what we do involves integrations with other team’s deliveries, usually two or more systems need to interact and will use a service layer as a communication broker, SOA in a nutshell.
Our team’s definition of Done is getting stuff into production. We do that quite well because we only put stuff in our backlog that we can deliver, our dependencies are managed elsewhere, usually on the backlog of the team we are dependent on.
But when it comes time to deliver the complete solution there are a lot of moving parts to keep track of and one of my roles is to coordinate amongst the teams and make sure that each team knows what actions they need to take in order for the roll-out of the entire solution to be successful. Often this process takes weeks to complete because there can be data migrations, third-party upgrades, etc. My primary focus is the order things need to happen in, and which things involve more than one team to make it work. Optimising the schedule of events comes after.
I immediately found it natural to extend user story mapping to planning product roll-outs. This gives us all the benefits of visualisation and discovery that happen when we do product discovery. All the teams can see how the roll-out will be done and where everyone is involved. I call this a Delivery Storyboard. The Delivery Storyboard is completely separate from the User Storyboard we use for product discovery.
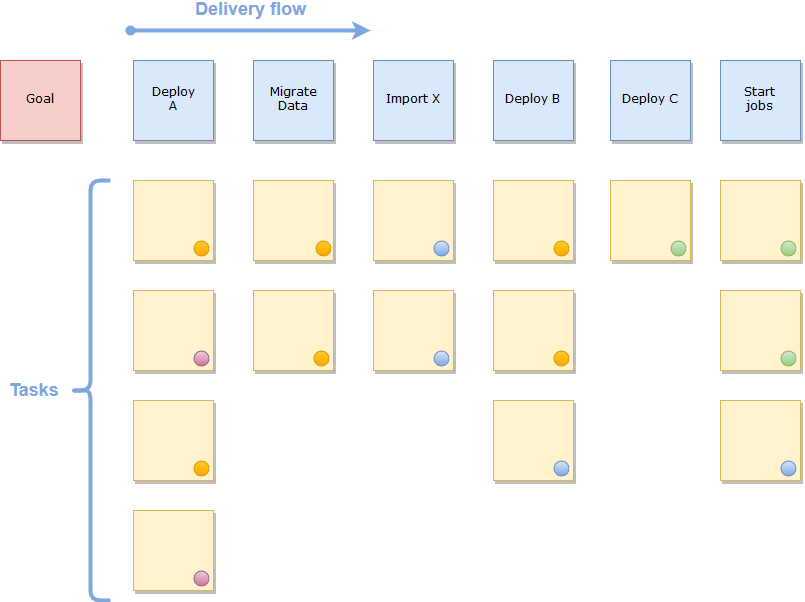
The delivery storyboard features a backbone (blue post-its) and describes a flow from left-to-right as usual. The flow in this case is the flow of execution of the activities needed to complete the roll-out. Each backbone activity is broken down into tasks (yellow post-its) that are placed underneath. An example of a task could be “Deploy component X to server” or “Import data file to System A”.
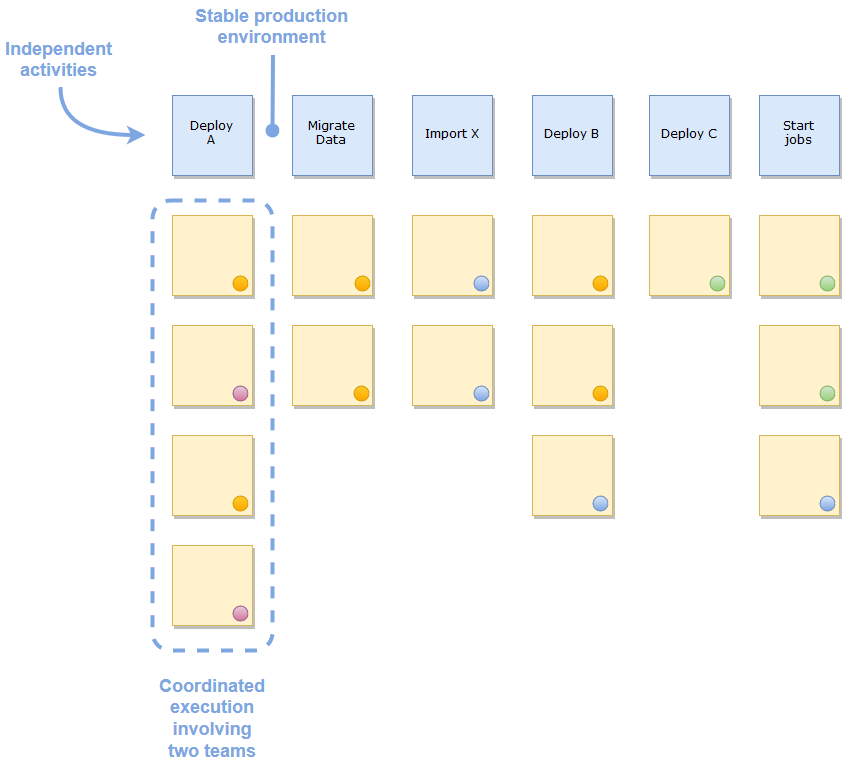
Now for the cool part. Each column is independent of every other column, whereas everything in the column has to be executed more or less at the same time. In other words, we focus on executing all the tasks in one column until completion. The next column can be executed an arbitrary time later, but then all of the tasks in that column must be executed together as well. Repeat the process until the last column is executed and the roll-out is complete.
When all the tasks in any column are completed, the production environment should be left in a stable state and not dependent on other tasks in other columns for the time being. The challenge then is creating an execution flow that is flexible and does not have dependencies or hard time limits between the tasks in one column and the tasks in the next. Of course this can’t always be avoided, but one of the goals here is to visualise these types of constraints!
Another problem I have encountered is that some tasks in the middle of the flow need to be (or can be) executed first. Either the columns need to be reordered or, the storyboard is trying to meet more than one goal. In the later case, try writing down the original goal on a post-it and see if all of the tasks on the board are needed for that goal. Then write another goal on another post-it for the remaining tasks and so-on. Each goal then deserves its own storyboard (big or small). This mirrors the concept of MVP (Minimum Viable Product) that Jeff Patton describes in his excellent book User Story Mapping.
And as always, regular stand-ups with all the teams involved, usually one representative from each team if there are many teams. Depending on where in the execution flow the roll-out is, not everyone needs to be at every stand-up. The teams walk through the delivery process, breaking down the work into concrete activities with clear responsibilities.
Each task is the responsibility of a specific team, and every task is tagged with a coloured sticker to indicate the team responsible. During product development, tasks, user stories, etc. are usually maintained in the team’s product backlog and this may still be so for some of the tasks on the Delivery Storyboard, but now they are duplicated here because we want to visualise dependencies to other teams, and where they will feature in the roll-out plan. If they have a JIRA issue number then write that on the post-it too.
A column with tasks that have different colour tags visually indicates where teams need to coordinate closely. That is pretty neat. Participants in the stand-ups can talk to each other about how they should collaborate to get the backbone item delivered successfully. During storyboarding sessions with the teams we can easily reorganise the tasks to minimise risk, reduce lead time and reduce downtime. The tasks in the column can also be ordered top-down to indicate the order of execution if meaningful.
When a task is completed you should mark it somehow, for example crossing it out using a green marker. This provides a visual cue to focus on the remaining tasks as well as green being a positive colour.
The Delivery Storyboard can be complemented with dates concerning when certain columns and/or tasks are to be executed which is useful for planning to meet deadlines. However, the main focus is on the sequence of events, who-does-what and where do teams need to coordinate their deliveries. Finally, the board should contains only tasks that will be executed, hopefully we are not doing product discovery at this late stage.