If you are using releases and Kanban boards in Jira, then you will most likely have a problem with issues not showing on the Kanban board. Specifically, issues are hidden if that have been released but their status is something other than “Done”. This can easily happen as Jira does not check if all issues are done before executing the release. The problem is the Kanban board sub-filter:
fixVersion in unreleasedVersions() OR fixVersion is EMPTY
This means that if the release version of an issue is set then it will be hidden as soon as the release is made in Jira regardless of the issue’s status. From the team’s perspective this is probably perfectly fine, these issues were done in practice it was just that there status was incorrect in Jira. In the worst case real work is hidden. Another problem is that even if the work is done, leaving the issues open skews the data Jira relies for the various graphs and metrics that it provides, e.g. team velocity.
To fix this, what we want is to only hide issues that are released and have status “Done”. To do this we update the filter to:
(fixVersion in releasedVersions() AND status != Done) OR
fixVersion in unreleasedVersions() OR fixVersion is EMPTY
Now all issues are displayed until the team actually sets the status to “Done”, which is the more intuitive behaviour. And if the release has been made before the status is set to “Done” then the issue will disappear immediately from the Kanban board.
Expect that old issues will reappear on the board when the filter is applied, but this doesn’t take long to clean up. Alternatively the filter above can be used to search for these old issues and close them first, but it is probably easier and better to let the developers do it themselves.
Agile teams often use velocity as a metric to measure the team’s performance. This is a measure of the throughput of the team, how fast they are at delivering stuff. But this metric alone cannot be used to determine if the team are making customers happier or helping the company to make money.
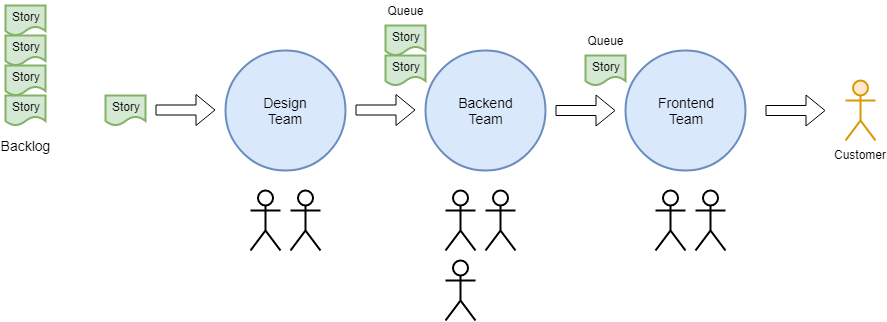
To illustrate the problem let’s suppose we have three delivery teams in a chain. The first team pulls stories from the backlog and feeds them to the next team and so on until the feature is delivered to the customer. Throughput is low, so the company hires a couple of agile coaches to help the teams work more efficiently. Their goal is to:
Increase team velocity.
The coaches are good at their jobs, helping each team create INVEST-type stories, remove impediments, focus on delivering one thing at a time, CI/CD, etc. They soon maximise the team’s efficiency, realising their full potential, velocity reaches 100%, hurrah! But wait, there is still a bottleneck; the capacity of the FE team is limiting the flow of features to the customer. The queue of stories is also problematic as the all important shared understanding between teams is quickly lost as the wait-time between work centres becomes longer. What did the coaches miss?
What the scenario shows is that the Agile coaches cannot focus solely on the velocity of stories in the individual teams. It is still a useful measurement for planning team capacities, but the goal cannot be to maximise this value. If velocity can’t be used to solve the queue problem, then the coaches need another measurement that does. Observe that the wait-time between work centres delays the feature getting to the customer. In other words, wait-time adds to the total time needed to design, build and deliver features, i.e. it increases lead time. The coaches are given a new goal:
Increase team velocity while minimising the lead time for new features.
When should the coaches start measuring lead time? Probably from the time the company commits to delivering the feature. How do the coaches measure lead-time? Well, if the product owners are using a Kanban board for example, then they can just write the date on the card when they committed to building and delivering the feature. Then, when the feature begins its journey across the board the coaches can measure how long it took to reach the customer.
The coaches now have two conflicting metrics. On the one hand the team want to maximise their story velocity (local efficiency), but on the other hand the company wants to reduce time-to-market (TTM) (i.e. minimise lead time). (I am deliberating ignoring throughput which is the average time to deliver any feature. Even if throughput is high, it could still take months to deliver any one particular feature if the lead time is long. Thus, adapting to change becomes hard.)
Conclusion: the team must subordinate itself to the company’s goal. This means that if there is a downstream bottleneck (the FE team), then the BE team cannot keep pushing more work into their queue. In practice this means that the BE team cannot start a new story until the queue is cleared. The best way to manage this is using pull instead of push. If the BE team is finished with a story, then it is still included in their WIP limit (Work-In-Process rather than Work-In-Progress) preventing the team from starting a new story. When the FE team is ready to work on a new story they pull it from the BE team.
Do the BE team go home and wait for the FE team to pull the story? Ideally yes, in reality, no; there is always work to be done. Software systems pay a perpetual rent, what can be called maintenance debt, that must be continuously paid off to prevent the slow glide into non-compliance and obsolescence. In practice, the team should maintain a technical backlog of work that they can do while waiting for the bottleneck to pull work.
A more realistic scenario would be that the Design team releases the story simultaneously to the Frontend and Backend teams to work on. This is what happens in loosely-couple architectures; the two teams can agree on a contract and then work independently of each other to deliver their respective parts. This would improve lead time but there is still the problem of one team running faster than the other. What happens is that the bottleneck has moved to the end of the delivery process when the feature is delivered to the customer.
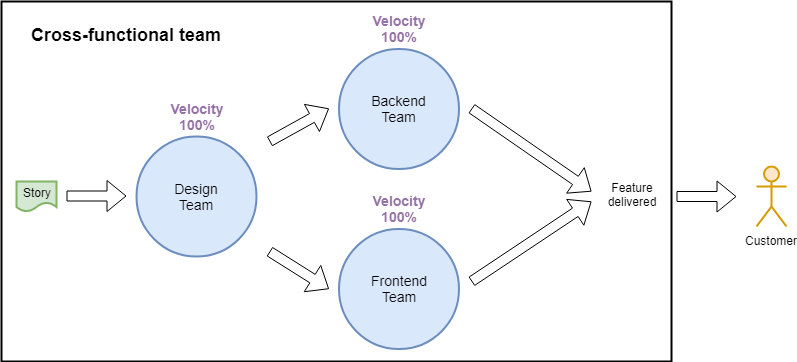
What more can our Agile coaches do to reduce lead times? Cross-functional teams are considered a good thing in Agile, can they help with reducing lead times? Let’s illustrate that in a completely new diagram.
What’s that? I just drew a box around the old diagram you say? OK, yes, I did. Instead of three separate delivery teams, we now have one product team. It’s still the same mix of competencies and the same system architecture, so why would we expect the delivery process to behave any differently?
So how is using a cross-functional team better? Well, the delivery teams now have a common goal that is set by the Product Owner. (The PO must express the company’s goal in terms that are meaningful to the team.) Also, the potential for collaboration and innovation, and the ability to “build the right thing” can be fully exploited. What about velocity and lead time? Maximising velocity now also means reducing lead time. Since there is one WIP limit for the whole team, there are no queues, further reducing lead time. Well done coaches!
OK, let’s take a step back. The coaches are now using two metrics to achieve the goal of reducing lead times efficiently. The new cross-functional team is pumping out features faster than ever. Are the customers happy? Is the company making more money? Eh, still no idea. How do we measure customer happiness or the return-on-investment for all the features the team is delivering?
The team must find some way to measure the effect a feature has on customer growth or customer retention, or increase in revenue, or whatever is important to the company. However, the team’s velocity enables it to fire off lots of features in rapid succession, making it impossible to know which features are actually the ones that are helping the team achieve its goal, and which are just adding to system complexity and maintenance debt. Let’s call this the feature success rate, i.e. what percentage of features released move the team towards their goal.
Once again there is a conflict between two metrics: velocity and feature success rate. The customers must be given the time to evaluate each feature in turn in order for the team to know if it was successful or not. So now the customer has become a bottleneck with a WIP limit = 1. How do we increase the customer velocity?
One way is to divide the customers into groups, so-called A/B testing with each group evaluating different features or different versions of the same feature. But this is the most expensive way for the team to find out if they have built the right thing. Instead the team should try to figure out as early as possible and as cheaply as possible if a feature will move the team towards their goal: customer surveys, impact mapping, wireframes, etc.; whatever it takes to validate assumptions while building as little as possible. Also, when choosing between features the team should pick those that have the biggest impact. For our intrepid Agile coaches the goal is finally expressed as:
Increase team velocity and minimise the lead time for new features while increasing feature success rate.
Summary
One surprising result of this analysis is that it is not possible, nor desirable, for developers to spend 100% of their productive time developing features. This is something every Product Owner for a cross-functional team must be aware of. This is due both to the capacity constraints of the different competencies in the team, the variance in the work itself, WIP limits and the bottleneck (wherever that happens to be in the flow).
Developers must maintain a technical backlog to work on when they are blocked by WIP limits or starved of new work. Like automated testing, developers must also spend time devising methods to measure the impact of whatever features they create. This holistic approach will also help the team members better understand the team’s goal.
The purpose of this analysis was to identify the goal for an Agile coach and to find the minimum number of metrics that the Agile coach needs, to know if they are moving towards their goal. My conclusion is that these metrics are:
Team velocity to aid capacity planning and measure efficiency
Lead time to shorten TTM and allow the team to adapt to change quickly
Feature success rate to minimise the number of features used to meet the team’s goal
In short, the Agile coaches are moving towards their goal if the team’s velocity is increasing, lead time is reducing and feature success rate is increasing.
When adopting an Agile development process, the team should start with visualising their work using a Kanban board. At the start, the items on the board will probably cover a whole range of work including hopefully a few User Stories. What can happen then is that if the team uses these items to try to create flow they will probably end up trying to model their entire development process (from idea to product) on the Kanban board, or worse still, try to apply Sprint planning to it.
This is especially true for platform teams that move to become cross-functional teams. The problem is that a Kanban board can only really handle the flow of one type of object (i.e. model one process) and that object has to have a clear “Definition of Done”. But hey, the whole point of using Kanban is to visualise the work so the team can do something about it to improve flow.
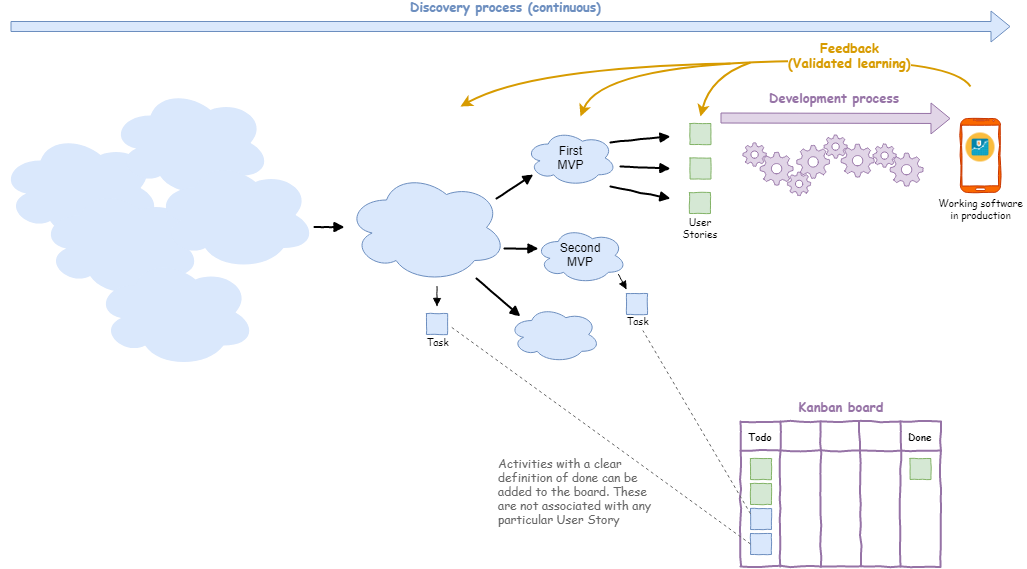
As I said, the Kanban board works best if you supply it with right-sized work items, and in software development these items are usually User Stories. But using Kanban to manage the flow of User Stories is only going to capture one part of the work that the team do to deliver the right thing to customers. The other part is the preparation of these valuable right-sized User Stories and their acceptance criteria, what is known as the Product Discovery process. Product Discovery and Product Development form a highly integrated dual-track development process.
Product Discovery follows a different process to User Stories: ideas are being analysed and discarded or morphing into something else. (It is a fluid process, but Kanban can still be used even here to visualise it). So even though the team could be spending 50% of their time breaking down the problem, defining an MVP and creating good User Stories, this effort will not be visible on the User Story Kanban board. Or more accurately, the time spent is not part of the User Story lifecycle, since the story can’t start its journey across the Kanban board until the discovery process is complete.
This is not to say that the team cannot visualise discovery work, it just means that it cannot be attached to any particular User Story. Instead the team can represent it using another object: the Task. Unlike Stories, Tasks do not deliver customer value. Tasks could cover any kind of activity: a spike, an analysis, purchasing a license, setting up an environment, etc. Even if there is no customer value involved, the team should still strive to create well-defined or time-boxed tasks: what is the spike attempting to prove? When is the setup complete? In other words, Tasks must also have a clear “Definition of Done”.
While the Kanban board can be used to track Tasks, the team should only use it for well-defined tasks. Activities like meetings and discovery sessions form part of the team’s work that should not be quantified using Kanban. After all, the goal is to deliver valuable right-sized User Stories to the customer, not to document the completion of Tasks.
Lastly, the team can benefit from being able to visualise which User Stories belong to which MVP. In Jira (for example) the team can group related User Stories using the Epic Issue Type. Thus, an Epic can be used to represent an MVP. If the team want to track activities related to breaking down the MVP, then they can also be associated with the Epic. Finally, the team can also create a separate Epic Kanban Board which track the flow of Epics: they are bigger objects that move more slowly but should still have a clear Definition of Done.
In this article I will discuss how to get started with Agile in the most hands-on way possible, with no discussion of frameworks and methodologies. I believe it is important to understand the essence of Agile first, as it is easy to be overwhelmed with all of the techniques and tools that have evolved from it (Scrum, XP, SAFe, etc.).
The goal then is to create an iterative software development process that can be improved upon continuously. The only tool you are going to need is a stack of post-its and some wall space or a whiteboard where the team can work together.
Start small, which means starting at the team level. Learning to work in an Agile way will also require some experimentation as every team works differently. The point being that you will need to create some slack in the team’s schedule if you want to change the way they work. Finally, you or the team lead will take on the roll of Agile Team Coach.
I should also mention that there’s lots of help out there: blogs, forums and books. One excellent resource is the Agile and Lean Software Development Group on LinkedIn. Now let’s get started!
Step 1: Visualisation
First the team should start by visualising the their work, this is especially true in software development which by nature is very abstract. By visualisation, I am not referring to traditional documentation which tries to capture an entire scope such as requirements or test cases. What you want to visualise here is what the team is doing right now. For this you use post-its. Every team member writes down what they are working on, big or small, together with their initials in the corner, and sticks it onto a whiteboard or wall.
Now the team have an opportunity to discuss the work, make adjustments, add or remove post-its. The team can try to group related activities for instance. Spend about 5-10 minutes at this, no more; just enough time to smooth out the rough edges.
Step 2: Create flow
The next thing the team need to consider is what the definition of “Done” is for each post-it note. By “Done” we mean that the team is finished with the work item; it could be putting software in production, writing a manual, upgrading a database, etc. In reality, a lot of teams starting out with Agile do not have a clear definition of Done for their work items, so don’t sweat it too much yet. Fixing this will be part of the improvement process mentioned later on.
Create three columns on the whiteboard or wall and label them: Backlog, Doing, Done. Now each team member places each of their Post-its into one of the three columns. Finished? Great! You have now created your first Kanban board. (Here we introduce the most elementary and useful of Agile tools, the Kanban Board.)
So now the team has visualised their work and created a flow of work from left to right on the board. Congratulations!
Step 3: Reflection
The whole exercise above shouldn’t take more than an hour for a team of 10 people. Stand back and take a look at it. It may be obvious that some items on the board have unclear scope and some items are very large (or small). We’ll come back to these issues later.
One final exercise, sum the number of post-its in the Backlog and Doing columns and divide them by the number of members on the team. This will give you some indication of how much multitasking is going on and how much overhead is being created due to context-switching.
Step 4: Focusing on the goal
OK, the team have taken the important first steps in becoming Agile. And they will continue taking small steps, applying well-proven techniques that will improve the flow of work. But let’s discuss the goal; where is the team trying to get to? In the book The Phoenix Project, Bill is inspired by Lean manufacturing techniques used on production lines. Bill’s goal becomes the creation of a factory production line for his IT Department. As stated in Agile Principle #8:
Agile processes promote sustainable development. The sponsors, developers, and users should be able to maintain a constant pace indefinitely.
In other words the team shall create a process that they can reuse to build whatever software solutions the organisation or customers need now and in the future. The team can now take their new Kanban board and visualised work flow and use it to build a software factory!
Step 5: Breaking down the work
In our first iteration the team’s work items had unclear scope and different sizes. The team should deal with the scope problems first. This can be solved by breaking these work items into smaller items, each with a clear definition of “Done”. Spend 1-2 hours on this step, starting with the most important work items.
A classic problem is that a work item involves input from people outside the team. The Kanban board should not contain items that are assigned to “outsiders”. If this external work is a prerequisite for completing a team work item, then it should be added as a dependency to a team work item only. It is essential that the team have control over the work items on their board, even if they are currently blocked by external dependencies. The Kanban board should be used to focus on the team’s work!
Sizing of work items is about creating items that are of roughly equal size. As a rule-of-thumb, a work item should take about 2-3 days to complete, up to a maximum of two weeks. There are techniques for standardising work sizes, but for now I recommend a simple consensus from the team on whether an item is large or small or somewhere in between. Remember, if the definition of “Done” is software in production, then this must include coding, testing, etc.
In the worse case, a work item is so badly scoped and sized that it may not be possible to continue working on it in its current state and some more analysis (of requirements or architecture) is needed. If work stops altogether on such items then it should be moved into the backlog. This is one of the hardest things to do in Agile, but really knowing when a work item is ready for execution is one of the great benefits Agile brings.
A clear definition of Done for each item together with creating items of roughly equal size will build team confidence. By breaking down work items into smaller chunks and visualising them on the Kanban board it becomes possible for every team member (and stakeholders!) to understand what the team is going to deliver. And getting items to Done will make everyone happy.
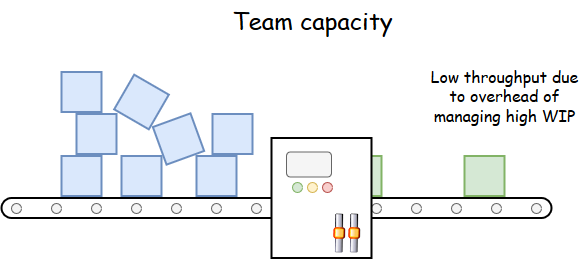
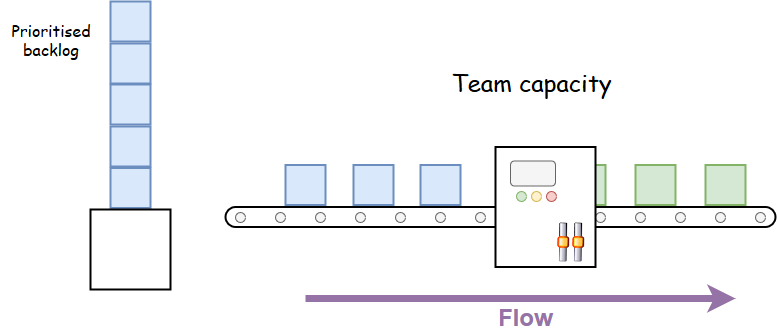
Step 6: Limiting Work in process (WIP)
At this point the team have broken down the work into similar size chunks and this probably means that there are many more post-its on the board. (There are many tools available for creating digital Kanban boards, but this is still a low priority for now; wait 2-4 weeks before taking that step.) What the team needs to focus on next is WIP. This exercise should take about 30-60 minutes.
Earlier the team calculated how many work items were being done per team member. Ideally, each team member should be working on one item at a time, i.e. sequentially; so for a team of 10, the number of work items in the “Doing” column would be 10. In practice the figure is higher and the team need to think about what that number is.
In Agile terms, we are talking about the team capacity. We use this figure to set a work in progress (or process) limit (WIP limit). In other words, the team cannot start a new work item until they have finished a work item that is already in progress (unless an item is blocked). Remember, the team have a clear definition of Done for every work item, so they are supposed to be able to complete them before starting something new.
WIP limits are extremely important in creating flow. It follows that if the team tries to complete 20 work items at the same time it will take twice as long as if they were working on just 10 items.
For now, there is just one column with work in progress (“Doing”). The team should try to estimate how many man-days of work is in that column. Anything more than 30-40 days (3-4 days x 10 people) worth of work should be moved to the Backlog, and this means prioritising what needs to get done first. Prioritising is the responsibility of the Product Owner or Business Manager responsible for the product being developed, so naturally they need to be involved. Agile creates visibility for both the team and stakeholders!
Step 7: Daily stand-ups
Book 10-15 minutes with the team every morning for a stand-up in front of the Kanban board to discuss the day’s activities. The stand-up is for the team only, but guests can be invited on occasion. Longer discussions should be saved for break-out sessions with those involved. The focus of the stand-up is to make sure everybody knows what they are doing, if there are any blockers that need to be escalated, and to check that the Kanban board is up-to-date.
In case it’s not obvious, the Kanban board has now become the most important tool the team have for organising and visualising their work. Well done!
Conclusion
The team have made great progress! They have managed to visualise their work, create flow, size their work items and limit their work in progress. This demonstrates the concept of Continuous Improvement (“Kaizan“) as preached in Lean manufacturing, meaning that the team are constantly looking for ways to improve the flow of work.
In Agile we use Retrospectives to specifically discuss how well the flow of work is, well, working. All the team are involved in suggesting improvements, and then some or all of the team are responsible for implementing at least one improvement right away. Process automation (e.g. test automation) is a classic example of improving flow.
There are many, many other techniques that are used as part of Agile such as User Stories, Storyboarding, Minimum Viable Products (MVPs), backlog refinement and measuring velocity to create an iterative software development process. Scrumis a subject onto itself. But these are topics for another article.
Further reading
I highly recommend the following books:
The Phoenix Project by Gene Kim
User Story Mapping by Jeff Patton
Lean from the trenches by Henrik Kniberg
Accelerate by Nicole Forsgren, Jez Humble and Gene Kim
In the book The Phoenix Project there is a part where Bill is discussing lead times with Wes and Patty. Even though a certain task only takes 30 seconds, the lead time is still hours due to the time spent waiting for a resource to become available (Brent). Bill draws a graph to demonstrate the problem: if a resource is fully (100%) utilised then wait times become very long.
This statement threw me for a bit until I did some research. The graph definitely nails the problem with trying to maximise utilisation of resources. I mean, it is counter-intuitive for a manager to allow resources to idle. So what is the graph actually showing?
The graph shows that when the average utilisation goes over 80-90% then wait times become very long. So over time, a very high average utilisation will cause the queue to grow very long, increasing lead times dramatically. In other words, if a resource is very busy then it cannot cope with a workload that varies. The team must be allowed some slack so that lead times are still reasonable even when the workload is sometimes higher than average. In short, there is a trade-off between workload variability and resource utilisation.
This is well-understood in the manufacturing industry, but it is intrinsically true for software development. Everything that is built in software development is a one-off, unique. This creates huge variability in the job times of the development process; no two projects are ever the same. The challenge then is to reduce this variability so that we can create a more predictable workload and push up utilisation.
In Agile we use techniques such as storyboarding, MVPs and backlog grooming to manage variability and ensure that we maintain flow. WIP limits and Velocity are our KPIs that let us know how well we are succeeding in maintaining flow. Flow refers both to managing the variability of the arrival time of work (i.e. breaking down the work into smaller deliverables) and the execution time of the job (e.g. sizing of User Stories).
The science
Back to Bill’s graph. Where does it come from? It is actually based on Kingsman’s formula which is from the domain of queueing theory. In layman’s terms the wait time is made up of three parts:
So what Bill is actually saying is that, given a certain variability and a certain job time, then the wait time will be a function of the utilisation as shown in the graph above. Bill wants to focus on utilisation, so he normalises the other parameters (variation and job time) as follows:
Variation is the norm in software development, so it has to be dealt with. There are several ways to mitigate variability. Reducing utilisation is one option, but we can do better than having our developers and testers idling.
Kingsman’s formula shows that adding more work centres reduces sensitivity to variation (as well as increasing capacity obviously). However, this is probably more feasible in manufacturing than in software development, because a work centre (i.e. a development team) often has domain expertise, i.e. no two teams have exactly the same capabilities. But this approach may be more applicable in larger organisations.
We have already mentioned reducing variability using Agile techniques such as storyboarding, MVPs and backlog grooming, and this should be the primary focus of the team coach in creating and optimising flow.
Another option available to development teams is to have a technical backlog containing work that is lower priority that can be used to fill idle time and bring utilisation closer to 100%. The kind of tasks in this backlog should be small and independent. For example, it could involve refactoring, writing automated tests, learning about a new technology, and so on.
In summary, it is the combination of these techniques that allows development teams to be fully utilised. What Lean teaches us, is that the same discipline and structure that is used to optimise manufacturing flows, applies even more so to software development.
Tracking the team’s velocity gives us insights into both utilisation and the amount of planned work vs. unplanned work. We can also track the velocity of both Stories and Epics to see how good we are at sizing our MVPs. (An Epic is always an MVP in my book; this makes it clear what the definition of Done is for an Epic).
Skipping the queue
One of the early problems Bill had to deal with was departments trying to skip the queue. This is the result of a chronic failure of the development process. If lead times become unacceptably long (due to high utilisation, high variability or both), then eventually people will try to find shortcuts. This just makes a bad problem even worse, and represents a total breakdown in the chain-of-command. That kind of short circuit has to dealt with before any other improvements have a chance of succeeding. Hence the need to start by visualising all of the work in process.
Inventory
I was almost going to write that inventory doesn’t cost anything in software development, after all it is virtual. We don’t have to purchase raw materials and we don’t have to store anything in warehouses. (Yes, GitHub costs something, but it is a negligible cost in this context.)
But there is still inventory in software. The raw materials are just ideas, one-liners that take up virtually no space at all and until the team commits to building (analysing, developing and testing) something, the backlog can be reorganised and priorities changed as often as desired.
The rest of the inventory is in the queues between work centres, e.g. when handing over from development to test. This inventory does represent an investment in time and effort, e.g. breaking down the problem, defining an MVP and coding a solution. The cost of having this inventory is that the knowledge about the solution disappears over time; no amount of documentation can replace the shared understanding that existed when the team were working actively on the solution. Furthermore, TTM is probably the single most important factor for success nowadays. So to sum up, a lot of inventory, or WIP, is bad in software development. Watch those WIP limits!
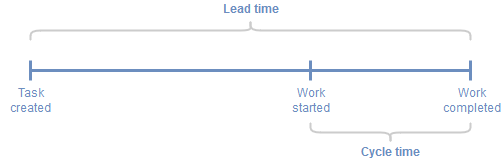
Cycle time
Here is an example of a good article describing Lead times and Cycle times. However, the difference between the two is not very clear in my opinion. A new Initiative will contain an unknown amount of work, that’s why we analyse it and break it down into reasonably sized chunks; we are reducing variability and minimising risk. A task (e.g. User story) is only added to the backlog when it is somewhat well-defined and so the Lead time for every deliverable is a reasonably well-understood and managed parameter. Otherwise, Lead times just becomes guess work and that is not so useful.
But the backlog doesn’t only contain planned work, it also contains unplanned work; bugs and outages which must be dealt with immediately. This increases the Lead time for planned work in ways that can be hard to manage. While unplanned work cannot be avoided completely, it can be mitigated using a small iterative release process, i.e. continuous delivery, continuous improvements to the delivery process, as well as detective and preventative security controls.
So ideally, Lead Time only applies to tasks that are MVP-sized and, we should also have a WIP limit on new work to control Lead time. It does not make sense to fill up the backlog with Tasks that will be delivered years from now. Doing this, we achieve an understanding of the team’s capacity and that long Lead times indicate the need for an increase in team capacity, the need for more teams, or a change in priorities.
My agile development team was involved in storyboarding and backlog grooming for all new tasks, not just development and testing. The team were constantly managing the flow of deliverables at all stages on the Kanban board, both when there were too few and too many tasks in a queue. So the difference between “Task created” and “Work started” was really very small, and therefore Cycle time should be uninteresting.
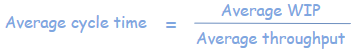
In queueing theory there is a formula known as Little’s Law which is used to calculate the Cycle time. So does this formula still have relevance even if we are not interested in Cycle time?
The term “Cycle time” is somewhat non-intuitive. But if you think about it, the cycle time is also the average time it will take to deliver everything that’s on your Kanban board right now. For example, if your WIP is 10 and your average throughput is 2 tasks/day, then your cycle time is 5 days/task. Or put another way, the team can deliver everything on the Kanban board within the next 5 days. Now that’s a rather powerful statement. So Cycle time is also the Turnover time for all WIP.
The better the team get at breaking down the backlog into equal-sized chunks (i.e. minimising variability), the more relevant the turnover figure becomes.
And so if Cycle times converge with Lead times, then we are much more sure of our commitments to the business side of the organisation. Roll-on Big Room Planning!
Storyboarding, or user story mapping, as described by Jeff Patton, is a central part of our Agile development process. We use it whenever we are doing feature discovery and it helps us structure our ideas without constraining the discussion. A lot of what we do involves integrations with other team’s deliveries, usually two or more systems need to interact and will use a service layer as a communication broker, SOA in a nutshell.
Our team’s definition of Done is getting stuff into production. We do that quite well because we only put stuff in our backlog that we can deliver, our dependencies are managed elsewhere, usually on the backlog of the team we are dependent on.
But when it comes time to deliver the complete solution there are a lot of moving parts to keep track of and one of my roles is to coordinate amongst the teams and make sure that each team knows what actions they need to take in order for the roll-out of the entire solution to be successful. Often this process takes weeks to complete because there can be data migrations, third-party upgrades, etc. My primary focus is the order things need to happen in, and which things involve more than one team to make it work. Optimising the schedule of events comes after.
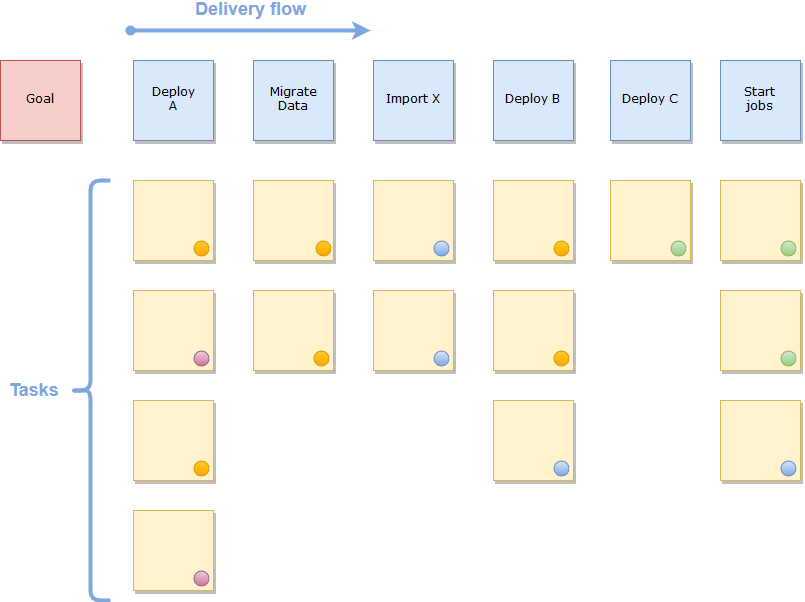
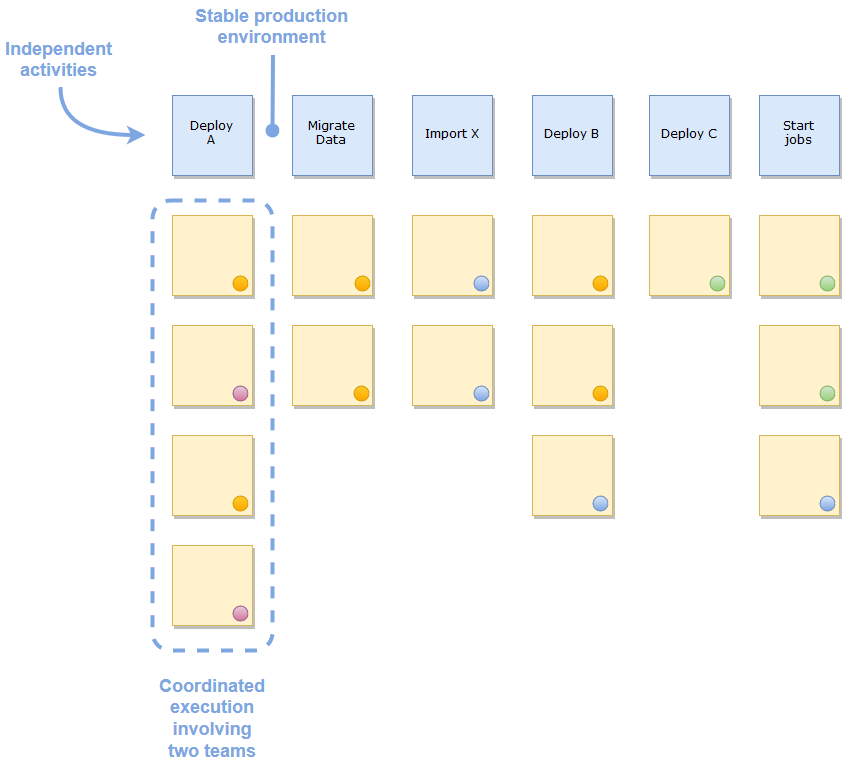
I immediately found it natural to extend user story mapping to planning product roll-outs. This gives us all the benefits of visualisation and discovery that happen when we do product discovery. All the teams can see how the roll-out will be done and where everyone is involved. I call this a Delivery Storyboard. The Delivery Storyboard is completely separate from the User Storyboard we use for product discovery.
The delivery storyboard features a backbone (blue post-its) and describes a flow from left-to-right as usual. The flow in this case is the flow of execution of the activities needed to complete the roll-out. Each backbone activity is broken down into tasks (yellow post-its) that are placed underneath. An example of a task could be “Deploy component X to server” or “Import data file to System A”.
Now for the cool part. Each column is independent of every other column, whereas everything in the column has to be executed more or less at the same time. In other words, we focus on executing all the tasks in one column until completion. The next column can be executed an arbitrary time later, but then all of the tasks in that column must be executed together as well. Repeat the process until the last column is executed and the roll-out is complete.
When all the tasks in any column are completed, the production environment should be left in a stable state and not dependent on other tasks in other columns for the time being. The challenge then is creating an execution flow that is flexible and does not have dependencies or hard time limits between the tasks in one column and the tasks in the next. Of course this can’t always be avoided, but one of the goals here is to visualise these types of constraints!
Another problem I have encountered is that some tasks in the middle of the flow need to be (or can be) executed first. Either the columns need to be reordered or, the storyboard is trying to meet more than one goal. In the later case, try writing down the original goal on a post-it and see if all of the tasks on the board are needed for that goal. Then write another goal on another post-it for the remaining tasks and so-on. Each goal then deserves its own storyboard (big or small). This mirrors the concept of MVP (Minimum Viable Product) that Jeff Patton describes in his excellent book User Story Mapping.
And as always, regular stand-ups with all the teams involved, usually one representative from each team if there are many teams. Depending on where in the execution flow the roll-out is, not everyone needs to be at every stand-up. The teams walk through the delivery process, breaking down the work into concrete activities with clear responsibilities.
Each task is the responsibility of a specific team, and every task is tagged with a coloured sticker to indicate the team responsible. During product development, tasks, user stories, etc. are usually maintained in the team’s product backlog and this may still be so for some of the tasks on the Delivery Storyboard, but now they are duplicated here because we want to visualise dependencies to other teams, and where they will feature in the roll-out plan. If they have a JIRA issue number then write that on the post-it too.
A column with tasks that have different colour tags visually indicates where teams need to coordinate closely. That is pretty neat. Participants in the stand-ups can talk to each other about how they should collaborate to get the backbone item delivered successfully. During storyboarding sessions with the teams we can easily reorganise the tasks to minimise risk, reduce lead time and reduce downtime. The tasks in the column can also be ordered top-down to indicate the order of execution if meaningful.
When a task is completed you should mark it somehow, for example crossing it out using a green marker. This provides a visual cue to focus on the remaining tasks as well as green being a positive colour.
The Delivery Storyboard can be complemented with dates concerning when certain columns and/or tasks are to be executed which is useful for planning to meet deadlines. However, the main focus is on the sequence of events, who-does-what and where do teams need to coordinate their deliveries. Finally, the board should contains only tasks that will be executed, hopefully we are not doing product discovery at this late stage.